| / Home |
Keywords: regression
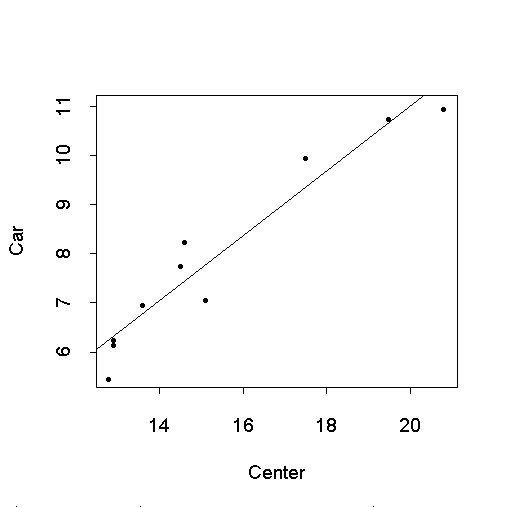
For each of ten streets with bike lanes, investigators measured the distance between the centre line and a cylist in the bike lane. They used photography to determine the distance between the cyclist and a passing car on those same ten streets, recording all distances in feet.
Data File (tab-delimited text)
| Effects of bike lanes on driver and bicyclist behavior, ASCE Transportation Eng. J., 1977, pages 243-256. |
| Devore, J. L. (1982). Probability and Statistics for Engineering and the Sciences. Brooks/Cole, Pacific Grove, California, pages 432-433. |
| Rasmussen, S. (1992). An Introduction to Statistics with Data Analysis. Brooks/Cole, Pacific Grove, California, Example 15.3. |

Call: lm(formula = Car ~ Center)
Residuals:
     Min      1Q  Median     3Q    Max
 -0.7699 -0.4485 0.03493 0.3561 0.8415

Coefficients:
              Value Std. Error t value Pr(>|t|)
(Intercept) -2.1825  1.0567    -2.0654  0.0727
     Center  0.6603  0.0675     9.7858  0.0000

Residual standard error: 0.5821 on 8 degrees of freedom
Multiple R-Squared: 0.9229
F-statistic: 95.76 on 1 and 8 degrees of freedom, the p-value is 9.975e-006
|
Home - About Us -
Contact Us Copyright © Gordon Smyth |